Dashboard Redesign
DASHBOARD REDESIGN iNITIATIVE

DURATION
8 weeks
MY ROLE
UX Researcher, Visual Designer
TOOLS
Sketch App, Invision, Trello, Slack, Zoom, Mural App, paper, pen, sticky notes, community, and teamwork.
PROCESS

PROJECT OVERVIEW
Company.com provides businesses with a digital experience platform, containing necessary and vital products and services that one needs to run a business. Using this product not only makes completing back-end business tasks simpler, but it is all in one place, paid via one bill.
The problem
Consumers are confused/don’t know how to shop, buy, and use business service products of value to them that we offer.
The goal
Find ways to make our products easy shop, buy and use. A key assumption is that we will be able to do this by redesigning the current dashboard. We conducted preliminary research to identify what consumers seek when looking at services like Company.com, the current pain points and assess the impact that redesigning the dashboard may have on user experience and workflow.
Summary
Focusing on engagement concerns related to the Company.com dashboard
Conducted discovery research (qualitative IDIs) with 23 current users/prospects
Identified four key problem areas across both new / existing small businesses
Ideated on solutions with full Dev/Marketing team - 160+ ideas generated
Tested 3 rounds of lo-fi wireframe designs via qualitative research - 48 individuals
Two quantitative surveys conducted for Dashboard / Products ~ 300 respondents
the problem to solve
How might we create such a compelling experience around shopping, buying and using business services for prospects and customers, that they can’t imagine living without them?
success measures
Increase Repeat Usage ((DAU)/(MAU))
Increase % of Paid Users and % of ‘More Paid’ monthly (Baseline needed)
Increase Customer Satisfaction (NPS) from 23 to 30
Increase Avg time on site per month from 1:50 to TBD
New designs score 4.5+ (out of 5) on how much experience matches ‘promise’
New designs score 4.5+ (out of 5) on understanding what we do
New designs score 4.5+ (out of 5) on how much value the consumer perceives
the approach
Human Centered Design (HCD) supplemented with quantitative research:
Focus on qualitative user-driven research
Early/frequent feedback on low-fidelity concepts / ideas
Design / Test multiple approaches
A key principle of HCD is to work iteratively. Make progress, test it out, and apply what we learn in the next iteration. This means that the initial stages of a product’s evolution are revisited early and often – a good thing. The feasibility of any feature, requirement, or characteristic is evaluated before significant resources are expended.
RESEARCH
discovery phase

Research Steps

hypothesis tested
Users trust Company.com and the services provided
Users value the ability to launch their own web apps through a link on the dashboard
Users prefer to see only the most relevant directories instead of all of them
Users understand the dashboard is one place where they can see all their products
The solution integrates the tools they’d expect in a way that delights them
Consumers understand the DVP for offerings (free/paid)
Consumers value the DVP for offerings
Users can tell what vendor is providing what offering
feedback
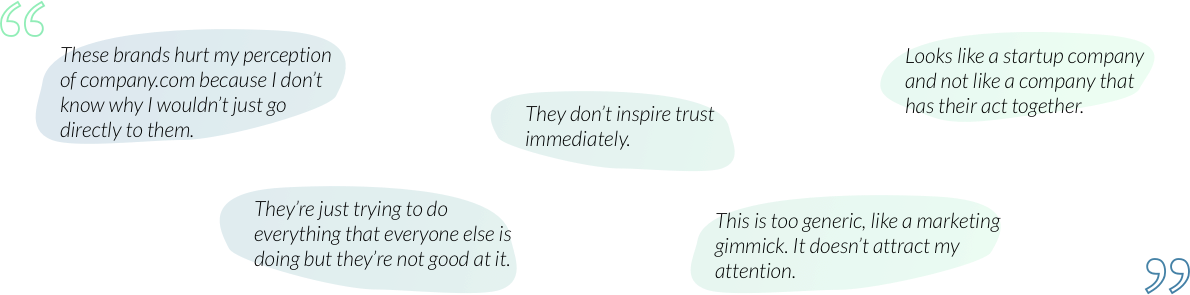
We color coded all of the feedback into 3 groups: good, bad, and has potential. We then organized the feedback into themes to look for patterns and we converged to focus on the four biggest issues impacting goals:

design/synthesize phase

Based on the four themes that were defined from the feedback, we created statement starters or “How Might We's.” These statements defined how we approach wireframes and prototypes to test with users.

Develop phase

impact/effort matrix
We decided to do a team activity that involved the marketing and engineering team so that we could have a better understanding of not only what would be of high impact from a UX perspective, but what is feasible from a developer’s perspective. As a collective, we wrote 160+ ideas. The teams selected ‘favorites’ and ran these ideas through impact & difficulty:

high impact/low difficulty
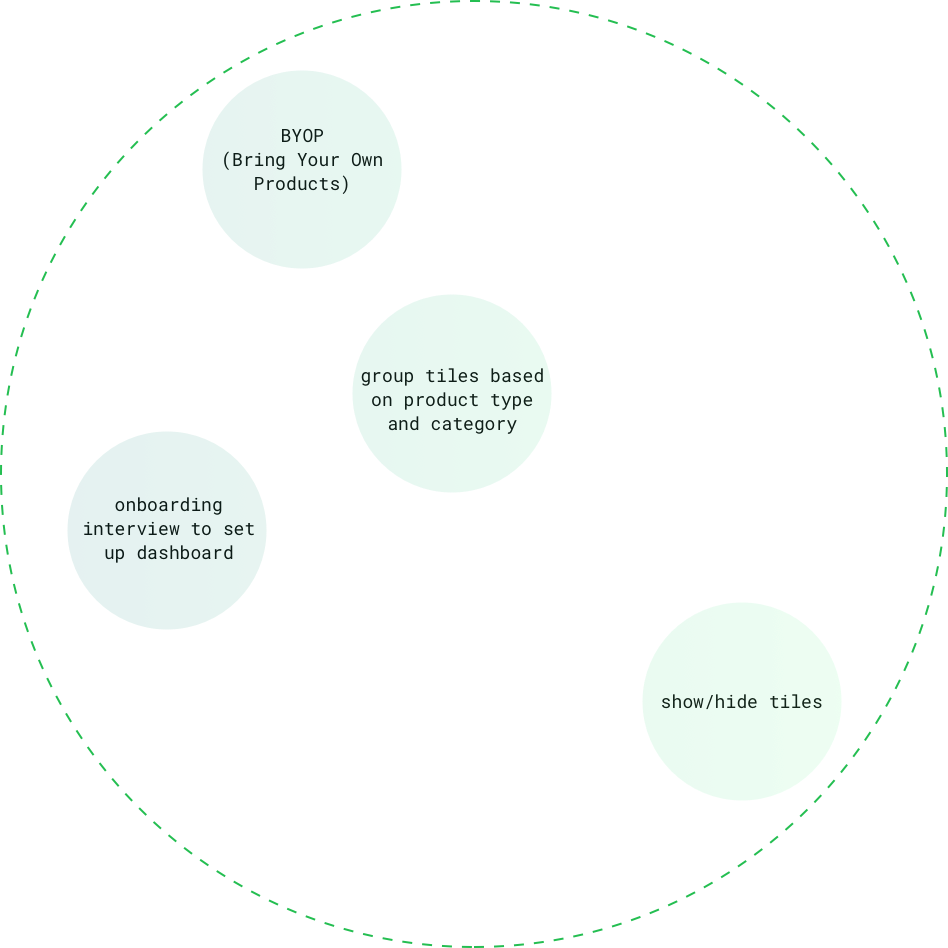
low-fidelity user testing
Now that we had a better understanding of what would have a high impact on users and a low difficulty for the develop team, we created low-fidelity wireframes to test with users.

storyboarding
After testing the low-fidelity prototypes, we created a storyboard to visual predict and understand the user’s experience with a product and identify the needs of that user.
insights discovered


deliver phase

mid-fidelity testing
Designed higher-fidelity prototypes of Dashboard, Interview, Business Listings and Reputation Management
Conducted remote user testing studies with 4-6 people per design
Converged on a design through three rounds of testing with 48 total small business owners
Collected qualitative/quantitative (Kano) feedback on the usability and value of features and the dashboard
Broke out work into MVP and versions

feedback
Based on feedback from the mid-fidelity test, we were able to create a list of “delighter features”, “one-dimensional features”, and “indifferent features.”
indifferent features
Master Calendar (related to all your tools) & Set Meetings
Bus Listings Mgmt / Visibility Report
Data Breach Protection
Product Inventory
Raising Capital / Funding
Social Media Management
Team Collaboration
Tech Support
Business Insurance
Job Postings
Project/Task Management
CRM
Legal Support (EXISTING)
Legal Support
delighter features
Set-up Legal Entity*
Getting Started To Do's
Banking / Financial Setup
Manage Financial Records
Set-up Business Listing (NEW)
Email Marketing Campaigns
one-dimensional features
Set-up business website/email
recommendations & next steps
recommendations
Test new marketing copy/imagery that focuses on specific tool features
Continue to iterate/test individual ‘Delighter/One-Dimensional’ feature designs
Add profiles / pictures of success stories of real Company.com users
Create ‘free’ paths to support users so they see Company.com as their advocate
Re-run Kano survey for ‘features’ focusing on ‘New Business’ owners
next steps
Build ‘new dashboard framework’ with existing tiles
Update Visibility Report based on learnings
Implement a fully fleshed out ‘interview’ from marketing site
Build a v1 of BYOP feature (Bring Your Own Product)
Measure first release for initial success metrics

